
Don’t simply show your data — tell a story with it! Storytelling with Data teaches you the fundamentals of data visualization and how to communicate effectively with data. You’ll discover the power of storytelling and the way to make data a pivotal point in your story. The lessons in this illuminative text are grounded in theory, but made accessible through numerous real-world examples — ready for immediate application to your next graph or presentation.Storytelling is not an inherent skill, especially when it comes to data visualization, and the tools at our disposal don’t make it any easier. This book demonstrates how to go beyond conventional tools to reach the root of your data, and how to use your data to create an engaging, informative, compelling story. Specifically, you’ll learn how.
Together, the lessons in this book will help you turn your data into high impact visual stories that stick with your audience. Rid your world of ineffective graphs, one exploding 3D pie chart at a time. There is a story in your data — Storytelling with Data will give you the skills and power to tell it.
Takeaways
Introduction
- Many folks create bad graphs because they disconnect the narrative from the visualization.
- Author learned how important combining narrative w/ visuals is with her work on Google’s People Analytics team
Six guidelines for making better visuals
- When presenting to your audience, you should display results of your explanatory analysis, not your exploratory analysis.
- To improve your explanatory analysis presentation, consider the following question:
- To whom are you communicating?
- the audience and your relationship with them
- What do you want your audience to know or do?
- consider the action, mechanism, and tone
- To whom are you communicating?
- How can you use data to help make your point?
- what data is available to help you make your point
Share your idea + a 3-minute story.
- Try using post-it notes to layout your logical progression to help you understand the story you are telling.
Chapter 2: choosing and effective visual
- Chapter explores the 12 visual the author most commonly uses in her presentation.
- There is no magic answer for the “right visual”. Chapter goes into greater detail on formatting particular visualization types for better results.
- The visual should tie directly back to your contextual question “What do I want my audience to know or do?”
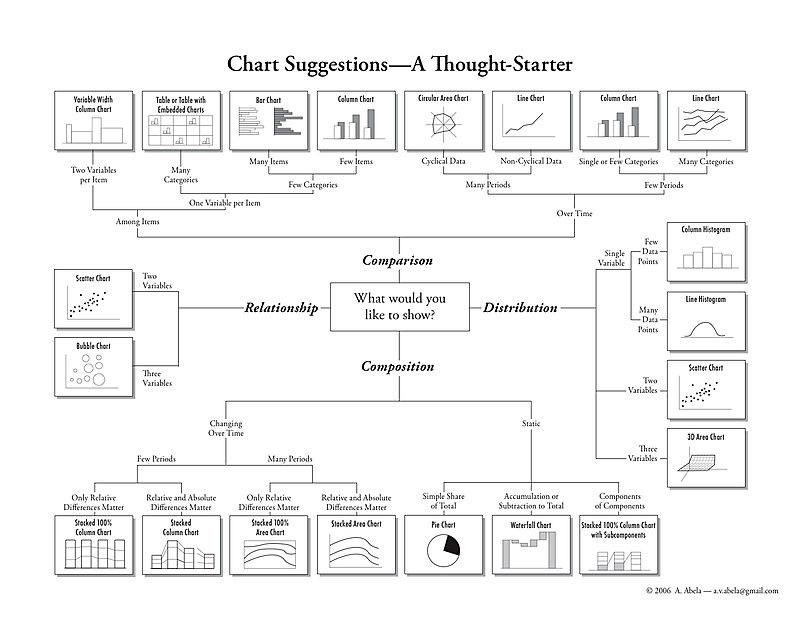
- Outside of this booked, here is the great guide for choosing a visual
Chapter 3: clutter is your enemy
- Every element you add to your report creates cognitive load for your audience
- Is the visual adding enough informative value given the context you established for your story. If not, remove the element/visual.
- Within each visual, you want to avoid clutter because it will overwhelm your audience and make the visual seem more complex than it needs to be.
Consider Principles of Visual Perception
- Proximity: things closer together are more related
- Similarity: group objects based on size, color, shape and orientation
- Enclosure: group objects that enclosed together
- Closure: our brains fill in the gaps when elements are missing, avoid overuse of borders
- Continuity: similar to enclosure, we will complete shapes & patterns in our minds when not explicit
- Connection: we assume relationship when drawing a line between objects (connect the dots)
- When clutter is thoughtfully removed, the audience doesn’t notice. Conversely, they will notice when clutter is present because they will feel the cognitive load. Get more comfortable with the use of white space
Chapter 4: focus your audience’s attention
Preattentive Attributes
- (size, color and position) can be used to:
- Iconic: extremely fast memory that initially assesses an environment for threats / triggers
- Short-term: memory that is used consciously and then converts to long-term or is forgotten
- Long-term: memory that is stored and used for pattern recognition
Demonstration


Iconic memory enables the audience to see what we want them to see before they are conscious of seeing it.
Visual Types of Preattentive Attributes
- Orientation
- Shape
- Line length
- Line width
- Size
- Curvature
- Added marks
- Enclosure
- Hue
- Intensity
- Spatial position
- Motion NOTE: Use Preattentive Attributes sparingly to enhance their capabilities
Chapter 5: think like a designer
Affordances
- Highlight what’s important using preattentive attributes
- Eliminate distraction because not all data is equally important
- Create a clear visual hierarchy of information to signal how the audience to process what is displayed
Accessibility
- Do not overcomplicate with data points, legends, or language
- Use text to help audience interpret information how you intend it to be interpreted
Aesthetics
- Be smart with color to highlight importance
- Pay attention to alignment to establish unity and cohesion with the information
- Leverage white space to limit complexity and increase the power of preattentive attributes
Audience Acceptance
- Articulate the benefits of the new approach through transparency to help audience become comfortable with the why behind the new visual
- Show a side-by-side if necessary between the old and new approach to help audience understand what is superior about the new visualization
- Provide multiple options and seek input to determine the best visual for the audience. Remember…it’s for them, not just you.
- Recruit a vocal member of your audience to help promote the visual for others and increase the chances of adoption.